Diagramming as Code in an Astro Blog: Graphviz, D2, Pikchr, and Mermaid
When writing ML posts I needed a sustainable way to produce diagrams. I evaluated four text-to-diagram tools and built a pre-build pipeline for Astro. Here is what each tool is actually good at, how to install them, and how to wire them in.
When I started writing posts about ML algorithms, I kept running into the same wall: I needed diagrams. Not decoration, but the kind that carry actual information, where a support vector machine without its decision hyperplane or a Viterbi algorithm without its trellis is just words pointing at something the reader cannot see.
The obvious workflow, drawing in a GUI and exporting a PNG, works once. It fails as a long-term approach because you lose the source, the image is not version-controlled in any meaningful way, and every small edit requires reopening the tool, redrawing, re-exporting, re-placing. For a blog where posts get revised, that overhead accumulates quickly.
The answer is diagramming-as-code: write a text description of the diagram, run a renderer, get an SVG. The problem is that there are several tools in this space and they are not interchangeable. They have different mental models, different strengths, and different integration stories.
I am still evaluating four: Graphviz, D2, Pikchr, and Mermaid. This post is where I am so far: what each one is, how to install it, how to integrate all four into an Astro build pipeline, and what each tool seems to be suited for. Particularly between Mermaid and D2 I have not settled on anything.
The Core Distinction
Before getting into specifics: these four tools do not all solve the same problem.
Graphviz, D2, and Mermaid are all graph tools. You describe nodes and edges, and the layout engine places everything. You give up control of exact position in exchange for automatic layout.
Pikchr is a drawing tool. You place objects at coordinates, either absolute or relative to each other. There is no layout engine. You get full geometric control and full geometric responsibility.
That distinction matters more than any feature checklist. If you need a scatter plot with a diagonal hyperplane, annotated data points at specific positions, and a margin annotation with arrows, that is a drawing problem. A graph tool will not solve it, regardless of how many features it has.
The Four Tools
Graphviz
Graphviz dates to 1991 at AT&T Bell Labs. It uses a language called DOT. You declare nodes and edges with attributes, and the layout engine figures out placement.
Several layout engines ship with it. dot produces hierarchical top-down or left-right layouts, which is the right choice for DAGs and most ML architecture diagrams. neato uses a spring model and can accept pinned coordinates, which lets you approximate geometric placement. circo and twopi handle radial layouts.
Installation is a system package, not npm:
brew install graphviz        # macOS
apt install graphviz         # Ubuntu / Debian
The CLI takes a DOT file and writes SVG:
dot -Tsvg input.dot -o output.svgHere is the VGG-16 CNN diagram written in DOT, and what the renderer produces:
digraph CNN {
  rankdir=TB
  fontname="monospace"
  bgcolor="#fafafa"
  nodesep=0.35
  ranksep=0.7
  label="VGG-16 Architecture — Convolutional Neural Network"
  labelloc=t

  node [fontname="monospace" fontsize=9 style=filled shape=rect]
  edge [fontname="monospace" fontsize=8 color="#555555"]

  node [fillcolor="#dbeafe"]
  input [label="INPUT  |  224 × 224 × 3  |  RGB image"]

  subgraph cluster_b1 {
    label="Block 1 — 36,928 params"
    style=filled fillcolor="#f0fdf4" color="#86efac"
    node [fillcolor="#bbf7d0"]
    b1c1 [label="Conv2D  |  64 filters  |  3×3  |  ReLU  |  224×224×64"]
    b1c2 [label="Conv2D  |  64 filters  |  3×3  |  ReLU  |  RF: 3×3"]
    b1p  [label="MaxPool  |  2×2, stride=2  |  112×112×64"]
    b1c1 -> b1c2 -> b1p
  }
  subgraph cluster_b2 {
    label="Block 2 — 221,184 params"
    style=filled fillcolor="#eff6ff" color="#93c5fd"
    node [fillcolor="#bfdbfe"]
    b2c1 [label="Conv2D  |  128 filters  |  3×3  |  ReLU  |  112×112×128"]
    b2c2 [label="Conv2D  |  128 filters  |  3×3  |  ReLU  |  RF: 7×7"]
    b2p  [label="MaxPool  |  2×2, stride=2  |  56×56×128"]
    b2c1 -> b2c2 -> b2p
  }
  subgraph cluster_b3 {
    label="Block 3 — 1,475,584 params"
    style=filled fillcolor="#fff7ed" color="#fdba74"
    node [fillcolor="#fed7aa"]
    b3c1 [label="Conv2D  |  256 filters  |  3×3  |  ReLU  |  56×56×256"]
    b3c2 [label="Conv2D  |  256 filters  |  3×3  |  ReLU"]
    b3c3 [label="Conv2D  |  256 filters  |  3×3  |  ReLU  |  RF: 16×16"]
    b3p  [label="MaxPool  |  2×2, stride=2  |  28×28×256"]
    b3c1 -> b3c2 -> b3c3 -> b3p
  }
  subgraph cluster_b4 {
    label="Block 4 — 5,899,264 params"
    style=filled fillcolor="#fdf4ff" color="#d8b4fe"
    node [fillcolor="#e9d5ff"]
    b4c1 [label="Conv2D  |  512 filters  |  3×3  |  ReLU  |  28×28×512"]
    b4c2 [label="Conv2D  |  512 filters  |  3×3  |  ReLU"]
    b4c3 [label="Conv2D  |  512 filters  |  3×3  |  ReLU  |  RF: 40×40"]
    b4p  [label="MaxPool  |  2×2, stride=2  |  14×14×512"]
    b4c1 -> b4c2 -> b4c3 -> b4p
  }
  subgraph cluster_b5 {
    label="Block 5 — 7,079,424 params"
    style=filled fillcolor="#fff1f2" color="#fda4af"
    node [fillcolor="#fecdd3"]
    b5c1 [label="Conv2D  |  512 filters  |  3×3  |  ReLU  |  14×14×512"]
    b5c2 [label="Conv2D  |  512 filters  |  3×3  |  ReLU"]
    b5c3 [label="Conv2D  |  512 filters  |  3×3  |  ReLU  |  RF: 88×88"]
    b5p  [label="MaxPool  |  2×2, stride=2  |  7×7×512"]
    b5c1 -> b5c2 -> b5c3 -> b5p
  }
  subgraph cluster_head {
    label="Classifier Head — 123,642,856 params"
    style=filled fillcolor="#fffbeb" color="#fbbf24"
    node [fillcolor="#fef3c7"]
    flat [label="Flatten  |  25,088 units"]
    fc1  [label="FC-4096  |  ReLU  |  Dropout 0.5  |  102.8M params"]
    fc2  [label="FC-4096  |  ReLU  |  Dropout 0.5  |  16.8M params"]
    fc3  [label="FC-1000  |  ImageNet classes  |  4.1M params"]
    soft [label="Softmax  |  1000-dim  |  Σ pᵢ = 1.0"]
    flat -> fc1 -> fc2 -> fc3 -> soft
  }

  edge [penwidth=1.5]
  input -> b1c1
  b1p -> b2c1
  b2p -> b3c1
  b3p -> b4c1
  b4p -> b5c1
  b5p -> flat
}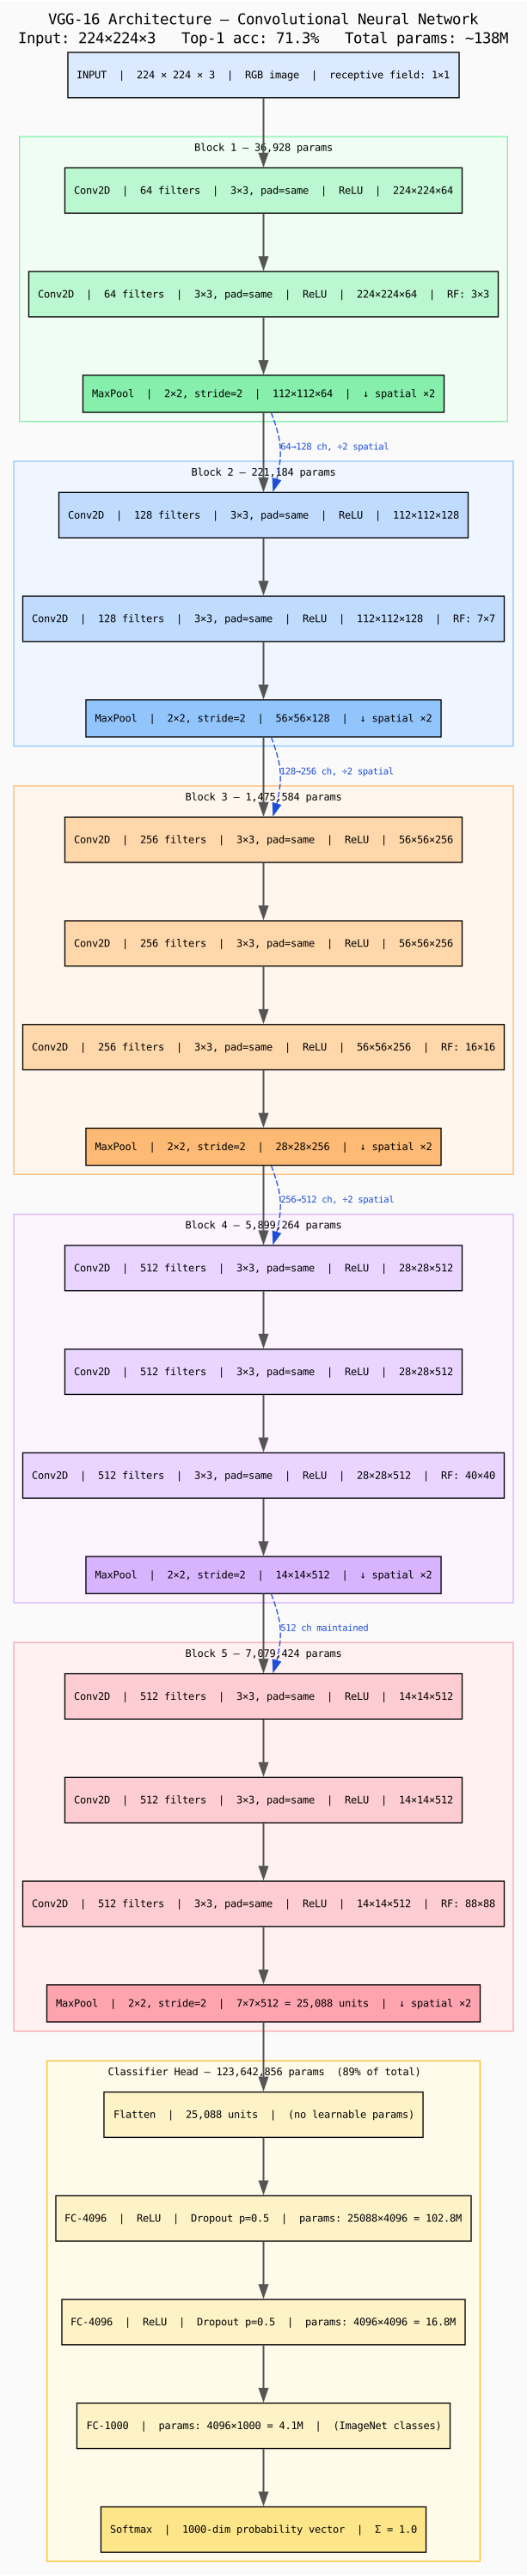
The DOT language is deliberately minimal. You describe topology, not appearance. That minimalism is mostly a virtue for the cases it handles well, but it becomes a constraint the moment you want precise visual control or non-graph shapes.
D2
D2 was released in 2022 and is the most modern of the four. It calls itself a diagram scripting language rather than a graph language. The distinction in practice: D2 has first-class nested containers, SQL table shapes, sequence diagram support, grid layouts, and multi-line markdown-formatted labels.
Also a system install:
brew install d2
# or via the install script:
curl -fsSL https://d2lang.com/install.sh | sh
The CLI:
d2 --theme=0 --layout=elk input.d2 output.svgLayout engines are pluggable. The default is dagre, which is the same engine Mermaid uses. The elk engine (Eclipse Layout Kernel) handles complex graphs with many cross-edges significantly better and is worth switching to. There is also a tala engine that is proprietary and requires a separate install.
The microservices architecture diagram in D2, and its output:
title: ML Platform — Microservices Architecture {
  near: top-center
  shape: text
  style.font-size: 20
}

direction: down

client: Client Layer {
  style.fill: "#e3f2fd"
  style.stroke: "#1565c0"

  web: Web App {
    shape: rectangle
    style.fill: "#bbdefb"
    label: "Web App\nReact / Next.js"
  }

  mobile: Mobile App {
    shape: rectangle
    style.fill: "#bbdefb"
    label: "Mobile App\niOS / Android"
  }

  sdk: Python SDK {
    shape: rectangle
    style.fill: "#bbdefb"
    label: "Python SDK\napi client"
  }
}

gateway: API Gateway {
  shape: rectangle
  style.fill: "#fff9c4"
  style.stroke: "#f9a825"
  label: "API Gateway\nauth, rate limiting\nrouting, logging\nnginx / Kong"
}

services: Core Services {
  style.fill: "#e8f5e9"
  style.stroke: "#388e3c"

  auth: Auth Service {
    shape: rectangle
    style.fill: "#c8e6c9"
    label: "Auth Service\nJWT / OAuth2\nuser management"
  }

  experiment: Experiment Service {
    shape: rectangle
    style.fill: "#c8e6c9"
    label: "Experiment Service\nhyperparameter search\nrun tracking\nMLflow"
  }

  training: Training Service {
    shape: rectangle
    style.fill: "#c8e6c9"
    label: "Training Service\njob scheduling\nGPU allocation\nk8s jobs"
  }

  inference: Inference Service {
    shape: rectangle
    style.fill: "#c8e6c9"
    label: "Inference Service\nmodel serving\nbatch + realtime\ntriton"
  }

  feature: Feature Store {
    shape: rectangle
    style.fill: "#c8e6c9"
    label: "Feature Store\nFeast / Tecton\nonline + offline"
  }
}

data: Data Layer {
  style.fill: "#fff3e0"
  style.stroke: "#e65100"

  postgres: PostgreSQL {
    shape: cylinder
    style.fill: "#ffe0b2"
    label: "PostgreSQL\nmetadata\nusers, runs"
  }

  s3: Object Storage {
    shape: cylinder
    style.fill: "#ffe0b2"
    label: "S3 / GCS\nmodels, datasets\nartefacts"
  }

  redis: Redis {
    shape: cylinder
    style.fill: "#ffe0b2"
    label: "Redis\nfeature cache\nsession store"
  }

  kafka: Kafka {
    shape: queue
    style.fill: "#ffe0b2"
    label: "Kafka\nevent streaming\nprediction logs"
  }
}

monitoring: Observability {
  style.fill: "#fce4ec"
  style.stroke: "#c62828"

  prometheus: Prometheus {
    shape: rectangle
    style.fill: "#f8bbd0"
    label: "Prometheus\nmetrics scraping"
  }

  grafana: Grafana {
    shape: rectangle
    style.fill: "#f8bbd0"
    label: "Grafana\ndashboards\nalerting"
  }

  drift: Drift Monitor {
    shape: rectangle
    style.fill: "#f8bbd0"
    label: "Drift Monitor\nEvidentlyAI\ndata + model drift"
  }
}

client.web -> gateway: "HTTPS"
client.mobile -> gateway: "HTTPS"
client.sdk -> gateway: "HTTPS"
gateway -> services.auth: "authenticate"
gateway -> services.experiment: "REST"
gateway -> services.training: "REST"
gateway -> services.inference: "REST / gRPC"
services.training -> data.s3: "save artefacts"
services.training -> data.postgres: "log runs"
services.training -> data.kafka: "publish events"
services.inference -> data.redis: "feature lookup"
services.inference -> data.kafka: "log predictions"
services.feature -> data.redis: "populate cache"
services.feature -> data.s3: "offline features"
data.kafka -> monitoring.drift: "stream"
services.inference -> monitoring.prometheus: "metrics"
services.training -> monitoring.prometheus: "metrics"
monitoring.prometheus -> monitoring.grafana
One practical downside: every D2 SVG embeds its custom font as a base64-encoded woff blob. A single diagram adds around 25 KB before any actual drawing content. On a post with several diagrams that is noticeable.
Pikchr
Pikchr is written by Richard Hipp, the author of SQLite. It is a drawing language in the tradition of the old Unix pic preprocessor. You place shapes at coordinates or relative to previous objects. There is no layout engine.
There is no Homebrew formula and no npm package. You build it from source:
git clone https://sqlite.org/pikchr pikchr
cd pikchr
make
The binary reads a .pikchr file and writes SVG to stdout:
./pikchr --svg-only input.pikchr > output.svgThe SVM diagram, which draws the decision hyperplane, margin planes, and scatter points at precise coordinates:
# SVM: Hard and Soft Margin Classification
# Detailed geometry + class annotations + kernel reference

scale = 1.0

# ── Title ─────────────────────────────────────────────────────────────────
text "SVM — Support Vector Machine: Geometry, Margins, Kernels" bold at 3.8,9.6

# ── Axes ──────────────────────────────────────────────────────────────────
arrow from 0.3,0.4 to 5.8,0.4
text "x₁  (feature 1)" small at 6.15,0.4
arrow from 0.3,0.4 to 0.3,5.2
text "x₂" small with .s at 0.3,5.35

# ── Axis tick marks ────────────────────────────────────────────────────────
line from 1.3,0.35 to 1.3,0.45
line from 2.3,0.35 to 2.3,0.45
line from 3.3,0.35 to 3.3,0.45
line from 4.3,0.35 to 4.3,0.45
line from 0.25,1.4 to 0.35,1.4
line from 0.25,2.4 to 0.35,2.4
line from 0.25,3.4 to 0.35,3.4
line from 0.25,4.4 to 0.35,4.4

# ── Decision hyperplane w·x+b=0 (thick, dark blue) ────────────────────────
line from 0.9,0.5 to 4.9,4.9 color 0x1e40af thick

# ── Margin planes w·x+b=+1 and w·x+b=-1 (dashed, medium blue) ────────────
line from 0.2,0.5 to 3.8,4.7 dashed color 0x3b82f6
line from 1.8,0.5 to 5.8,4.7 dashed color 0x3b82f6

# ── Hyperplane label ───────────────────────────────────────────────────────
text "w·x+b=0" small bold with .w at 5.0,5.1

# ── Margin labels ─────────────────────────────────────────────────────────
text "w·x+b=+1" small italic with .e at 3.55,4.85
text "w·x+b=−1" small italic with .w at 6.0,4.85

# ── Margin width annotation ────────────────────────────────────────────────
arrow from 2.8,2.5 to 3.5,2.5
arrow from 3.4,2.5 to 2.7,2.5
text "2/||w||" small bold with .s at 3.1,2.7

# ── Perpendicular tick on boundary ────────────────────────────────────────
line from 2.85,2.4 to 2.95,2.6 color 0x1e40af
line from 3.45,2.4 to 3.55,2.6 color 0x1e40af

# ── POSITIVE CLASS (circles, y=+1, upper-right) ───────────────────────────
circle radius 0.13 fill 0x86efac at 4.3,4.5
circle radius 0.13 fill 0x86efac at 4.8,4.0
circle radius 0.13 fill 0x86efac at 5.1,3.5
circle radius 0.13 fill 0x86efac at 4.6,3.2
circle radius 0.13 fill 0x86efac at 5.3,4.3
circle radius 0.13 fill 0x86efac at 4.9,2.8
circle radius 0.13 fill 0x86efac at 5.5,3.8

# ── NEGATIVE CLASS (boxes, y=-1, lower-left) ──────────────────────────────
box width 0.22 height 0.22 fill 0xfca5a5 at 1.0,1.0
box width 0.22 height 0.22 fill 0xfca5a5 at 1.6,1.6
box width 0.22 height 0.22 fill 0xfca5a5 at 0.7,1.9
box width 0.22 height 0.22 fill 0xfca5a5 at 1.3,2.4
box width 0.22 height 0.22 fill 0xfca5a5 at 0.9,0.7
box width 0.22 height 0.22 fill 0xfca5a5 at 1.8,2.0
box width 0.22 height 0.22 fill 0xfca5a5 at 0.6,2.8

# ── SUPPORT VECTORS (larger, darker border, on margin planes) ─────────────
circle radius 0.18 fill 0x4ade80 color 0x166534 thickness 0.06 at 3.8,4.2
circle radius 0.18 fill 0x4ade80 color 0x166534 thickness 0.06 at 4.3,3.5
box width 0.28 height 0.28 fill 0xf87171 color 0x7f1d1d thickness 0.06 at 1.5,0.7
box width 0.28 height 0.28 fill 0xf87171 color 0x7f1d1d thickness 0.06 at 2.0,1.8

# ── Support vector annotation arrows ──────────────────────────────────────
arrow from 4.8,4.6 to 4.0,4.28 color 0x166534
text "support vector" small italic with .w at 4.85,4.65
arrow from 4.8,3.7 to 4.45,3.55 color 0x166534

arrow from 0.6,0.5 to 1.38,0.68 color 0x7f1d1d
text "support vector" small italic with .e at 0.55,0.5
arrow from 0.9,1.6 to 1.85,1.78 color 0x7f1d1d

# ── SLACK VARIABLE example (misclassified / inside margin) ────────────────
circle radius 0.14 fill 0xfbbf24 color 0x92400e thickness 0.05 at 2.5,1.2
arrow from 2.5,1.34 to 2.5,1.65 color 0x92400e
text "ξ > 0" small bold with .w at 2.65,1.5
text "(slack: inside margin)" small with .w at 2.65,1.28

# ── Class labels ──────────────────────────────────────────────────────────
text "● y = +1" small bold with .w at 5.6,4.6
text "(positive class)" small with .w at 5.6,4.42
text "■ y = −1" small bold with .e at 0.4,3.0
text "(negative class)" small with .e at 0.4,2.82

# ── Optimisation box ──────────────────────────────────────────────────────
box "min  ½||w||²  +  C Σξᵢ" small bold "s.t.  yᵢ(w·xᵢ+b) ≥ 1−ξᵢ,  ξᵢ≥0" small width 2.6 height 0.6 fill 0xfef9c3 color 0xca8a04 at 3.8,7.8

# ── Kernel reference box ───────────────────────────────────────────────────
box "Kernels:  K(x,z) = φ(x)·φ(z)" small bold "Linear: x·z" small "Poly: (γx·z+r)^d" small "RBF: exp(−γ||x−z||²)" small width 2.6 height 0.8 fill 0xf3e8ff color 0xa855f7 at 3.8,6.8

# ── Legend box ────────────────────────────────────────────────────────────
box "Legend" bold "● Circle = positive (y=+1)" small "■ Square = negative (y=−1)" small "★ Larger border = support vector" small "✕ Yellow = slack ξᵢ > 0" small width 2.6 height 0.9 fill 0xf1f5f9 color 0x64748b at 3.8,5.7
The build-from-source requirement is real friction. It means documenting the build steps for any CI environment, and the binary path is machine-specific. If you are the only person building the site it is manageable. If not, it becomes a dependency management problem.
What Pikchr buys you in exchange is geometric expressiveness. The SVM diagram in this blog, the one with the decision hyperplane at a specific angle, support vectors at precise scatter positions, dashed margin planes, and a two-headed arrow annotating the margin width, is a Pikchr diagram. That specific diagram cannot be produced by Graphviz, D2, or Mermaid. Those tools lay out graphs. They do not draw geometry.
Mermaid
Mermaid is the most widely used of the four. It runs in the browser as a JavaScript library, which makes it the native diagram tool for GitHub, GitLab, Notion, and Obsidian. For a static site there is also a CLI (@mermaid-js/mermaid-cli, command mmdc) that renders SVG server-side via Puppeteer.
Installation is npm:
npm install --save-dev @mermaid-js/mermaid-cliThe CLI:
mmdc -i input.mmd -o output.svg --backgroundColor transparentThe --backgroundColor transparent flag matters if your site is not white. Without it you get a white rectangle behind every diagram.
Mermaid supports the most diagram types of any tool here: flowcharts, sequence diagrams, class diagrams, state diagrams, ER diagrams, Gantt charts, git graphs. Each has its own syntax.
The sequence diagram support is the strongest of any of the four tools. Loop blocks, alt/else branches, and notes are native constructs. Here is the ML training loop sequence diagram:
sequenceDiagram
    participant U as User / Researcher
    participant T as Trainer Process
    participant DS as DataLoader
    participant M as Model
    participant O as Optimiser
    participant V as Validator
    participant R as Registry

    U->>T: train(config, dataset)
    T->>DS: build DataLoader(batch_size=32, shuffle=True)
    DS-->>T: batched iterator

    loop Every Epoch
        T->>DS: next batch (X, y)
        DS-->>T: X ∈ ℝ^(32×d), y ∈ ℝ^32

        T->>M: forward(X)
        M-->>T: ŷ = σ(Wx + b)

        T->>T: loss = CrossEntropy(ŷ, y)
        Note over T: L = −Σ yᵢ log(ŷᵢ)

        T->>O: zero_grad()
        T->>T: loss.backward()
        Note over T,M: Compute ∂L/∂W via backprop

        T->>O: step()  [W ← W − η∇L]
        O-->>T: updated weights

        T->>T: clip_grad_norm_(max=1.0)
    end

    T->>V: evaluate(val_loader)
    V->>M: forward(X_val) for all batches
    M-->>V: predictions ŷ_val
    V-->>T: val_loss, accuracy, F1

    alt val_loss improved
        T->>R: save_checkpoint(model, epoch, metrics)
        R-->>T: checkpoint path
    else no improvement for patience=5
        T->>T: early_stop()
        T-->>U: best model at epoch k
    end

    T->>R: register_model(name, version, metrics)
    R-->>U: model URI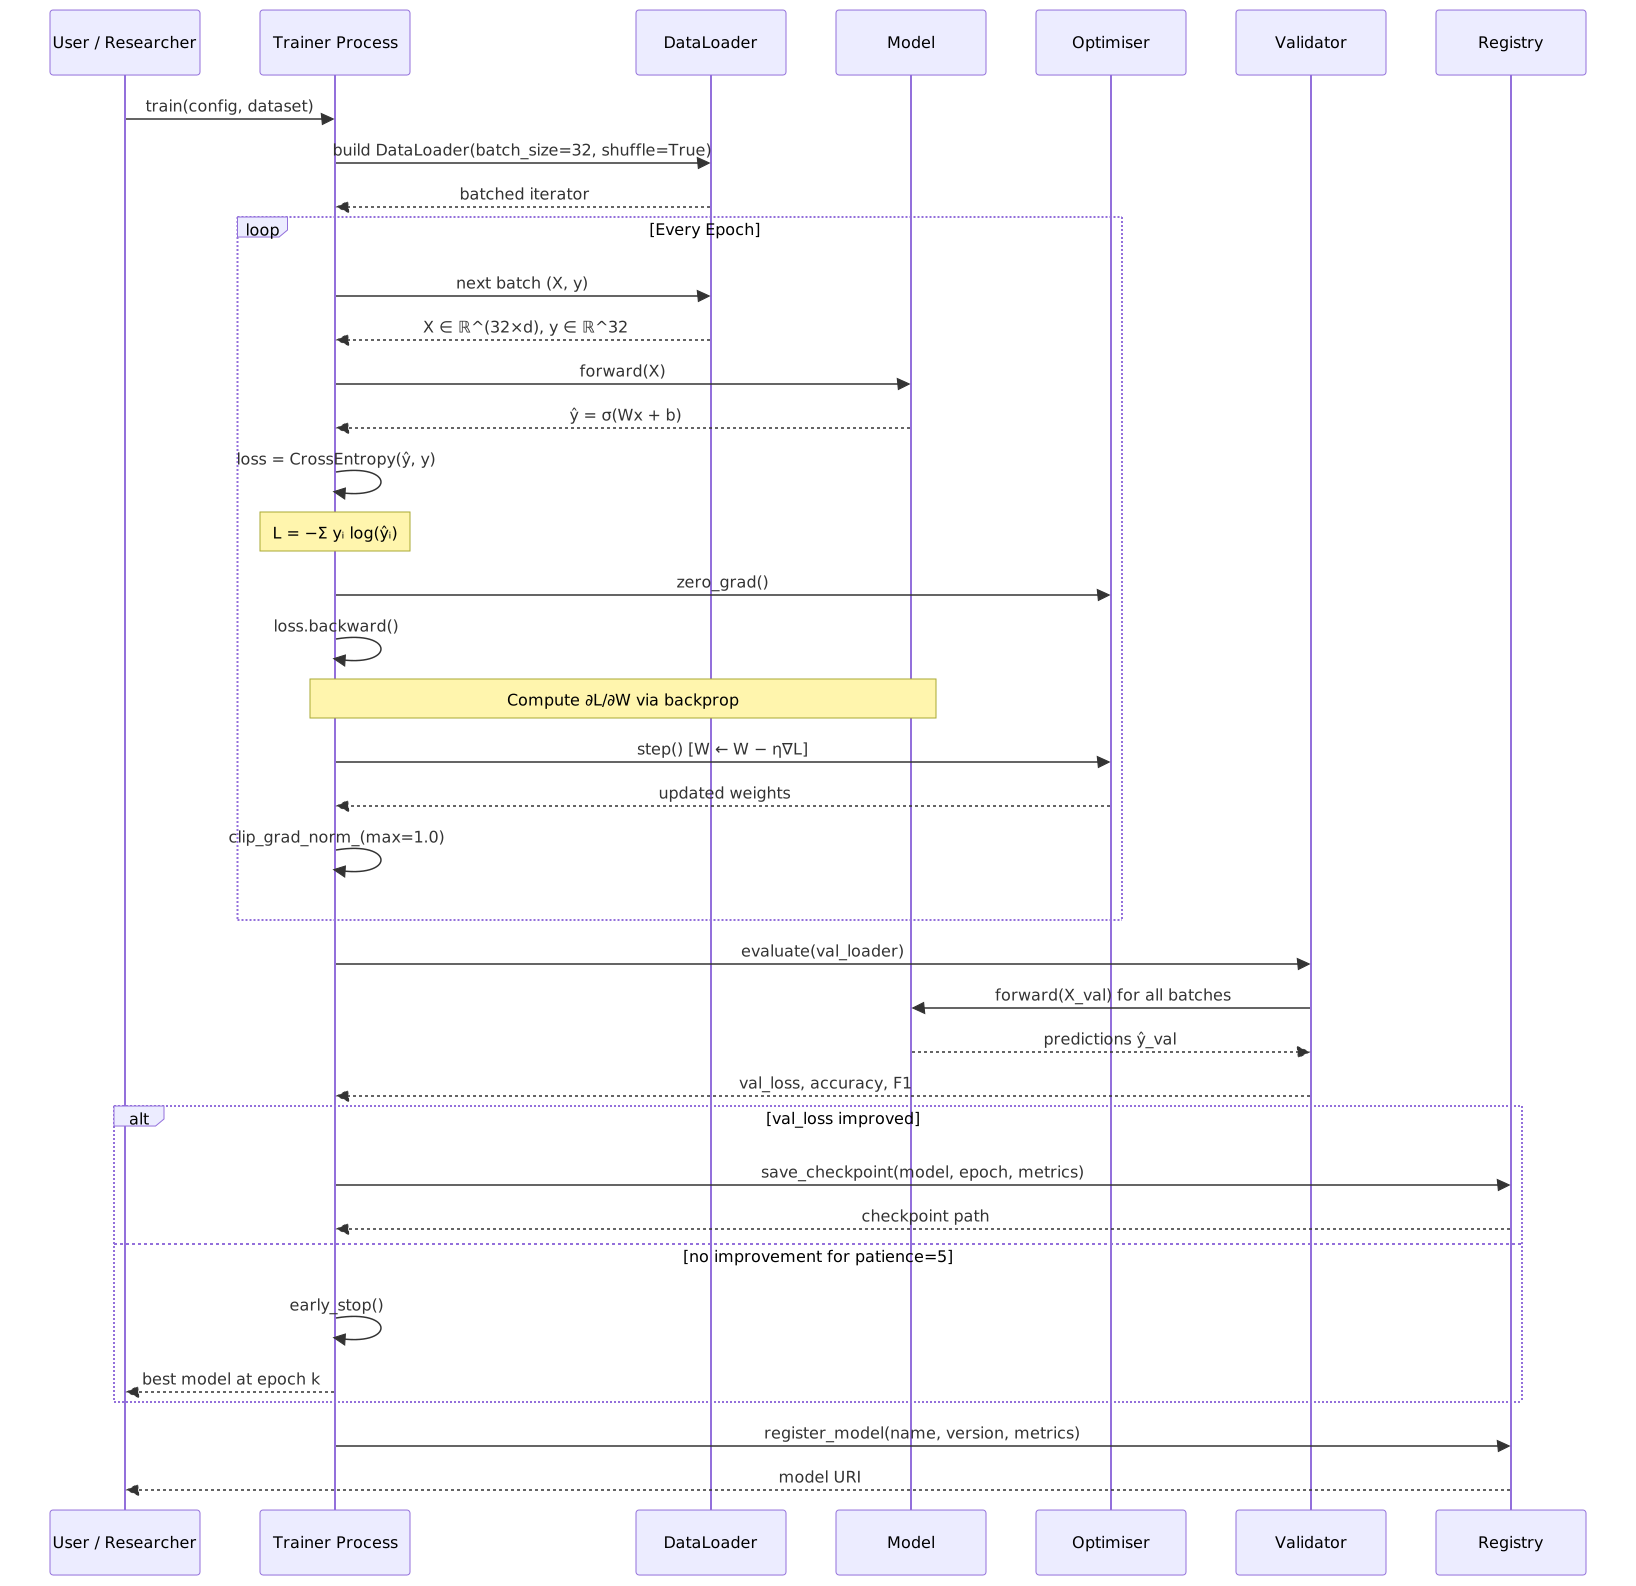
D2 has sequence diagram support but loop and alt blocks do not exist in its syntax. You annotate individual messages instead, which loses the structural grouping.
Feature Comparison
| Graphviz | D2 | Pikchr | Mermaid | |
|---|---|---|---|---|
| Language type | Graph (DOT) | Diagram scripting | Drawing / geometry | Diagram scripting |
| First released | 1991 | 2022 | 2021 | 2014 |
| Installation | System package | System package | Build from C source | npm |
| Output formats | SVG, PNG, PDF, many | SVG, PNG | SVG | SVG, PNG |
| Layout engines | dot, neato, fdp, circo, twopi | dagre, elk, tala | None (manual) | dagre (fixed) |
| Auto-layout | Yes | Yes | No | Yes |
| Nested containers | Subgraphs (limited) | First-class | Manual | Subgraphs |
| Flowcharts | Yes | Yes | Manual | Yes (native) |
| Sequence diagrams | No | Partial (no loop/alt) | No | Yes (full) |
| Class / ER diagrams | Manual | No | No | Yes (native) |
| Geometric drawing | Via neato (awkward) | No | Yes (native) | No |
| Custom colors | Yes | Yes | Yes | Yes (classDef) |
| Multi-line labels | Limited | Markdown-formatted | Yes | HTML in quotes |
| SVG file size | Small | Large (embedded font) | Small | Medium |
| Browser rendering | No | No | No | Yes (JS library) |
| GitHub native | No | No | No | Yes |
| Documentation | Good | Good | Minimal | Excellent |
| Community | Large, mature | Small, growing | Very small | Very large |
| Active development | Maintenance mode | Active | Active | Active |
| Diagram types | Flowcharts, DAGs | Flowcharts, seq (partial), containers | Drawing only | Flowcharts, seq, class, ER, state, Gantt, git |
Integrating All Four into Astro
The approach I use is a pre-build script that renders every source file to SVG. The SVGs land in public/ and Astro serves them as static assets. No Astro plugin, no remark integration, no runtime rendering.
Directory layout
technical-diagrams/       ← source files, not served
  graphviz/
    svm.dot
    cnn.dot
  d2/
    microservices.d2
    transformer.d2
  pikchr/
    svm.pikchr
  mermaid/
    training-sequence.mmd
    microservices.mmd

public/
  technical-diagrams/     ← rendered SVGs, served at /technical-diagrams/
    graphviz/
    d2/
    pikchr/
    mermaid/
Source files live at the project root, outside both src/ and public/. They are the version-controlled source of truth. The rendered SVGs in public/ are build artifacts.
The build script
scripts/build-diagrams.mjs globs for source files, skips any whose SVG is already newer, and dispatches to the right renderer:
import { execSync, spawnSync } from 'child_process';
import { existsSync, mkdirSync, statSync, writeFileSync } from 'fs';
import { globSync } from 'glob';
import { basename, dirname, join } from 'path';

const SRC = 'technical-diagrams';
const OUT = 'public/technical-diagrams';
const FORCE = process.argv.includes('--force');

function newerThan(src, out) {
  if (!existsSync(out)) return true;
  return statSync(src).mtimeMs > statSync(out).mtimeMs;
}

// Graphviz
for (const src of globSync(`${SRC}/graphviz/*.dot`)) {
  const out = join(OUT, 'graphviz', basename(src, '.dot') + '.svg');
  if (FORCE || newerThan(src, out)) {
    mkdirSync(dirname(out), { recursive: true });
    execSync(`dot -Tsvg -o ${out} ${src}`);
  }
}

// D2
for (const src of globSync(`${SRC}/d2/*.d2`)) {
  const out = join(OUT, 'd2', basename(src, '.d2') + '.svg');
  if (FORCE || newerThan(src, out)) {
    mkdirSync(dirname(out), { recursive: true });
    execSync(`d2 --theme=0 --layout=elk ${src} ${out}`);
  }
}

// Pikchr (writes to stdout)
for (const src of globSync(`${SRC}/pikchr/*.pikchr`)) {
  const out = join(OUT, 'pikchr', basename(src, '.pikchr') + '.svg');
  if (FORCE || newerThan(src, out)) {
    mkdirSync(dirname(out), { recursive: true });
    const result = spawnSync('./pikchr', ['--svg-only', src], { encoding: 'utf8' });
    writeFileSync(out, result.stdout);
  }
}

// Mermaid
const MMDC = 'node_modules/.bin/mmdc';
for (const src of globSync(`${SRC}/mermaid/*.mmd`)) {
  const out = join(OUT, 'mermaid', basename(src, '.mmd') + '.svg');
  if (FORCE || newerThan(src, out)) {
    mkdirSync(dirname(out), { recursive: true });
    execSync(`${MMDC} -i ${src} -o ${out} --backgroundColor transparent`);
  }
}
Add it to package.json:
{
  "scripts": {
    "diagrams": "node scripts/build-diagrams.mjs",
    "diagrams:force": "node scripts/build-diagrams.mjs --force",
    "dev": "npm run diagrams && astro dev",
    "build": "npm run diagrams:force && astro build"
  }
}
Referencing diagrams in MDX
Once the SVGs are in public/, you reference them as ordinary images:
No import, no component, no plugin. The SVG is a static file at a stable URL. It works in RSS, it is cacheable, and it can be linked to directly.
The alternative, using a remark plugin like astro-d2 to render D2 fenced code blocks inline at build time, keeps diagram source and explanation in the same file. That is genuinely convenient for short diagrams that belong to one post. The tradeoff is that you cannot reuse a diagram across posts and you cannot run the renderer separately from the Astro build. For now I prefer the explicit pipeline.
What Each Tool Is Actually Good At
Graphviz: structure that has a natural rank
Graphviz is best when the diagram has a clear directionality and you want the layout engine to enforce it. A neural network architecture, a compilation pipeline, a dependency tree, a Markov chain where arrows point forward in time. The dot engine’s rank-based placement produces clean results for these with almost no effort.
It is the wrong tool when you want visual control. The output can look mechanical, and adjusting layout requires indirect workarounds like invisible edges or rank constraints. Anything that is not fundamentally a graph is a fight.
D2: architecture diagrams with nested structure
D2 shines on the kind of diagram that describes a system: a microservices architecture, an ML platform with multiple layers, an infrastructure diagram where things live inside other things. The nested container syntax with named labels, the ability to connect nodes across container boundaries, and ELK’s edge routing all combine well for this.
Compared to Mermaid on the same microservices diagram, D2 with ELK routes edges more cleanly in dense graphs but produces a taller, more vertical layout. Mermaid’s dagre keeps things horizontal and compact. For that specific use case Mermaid actually won.
The embedded font is a real cost. It is worth knowing about before you commit to D2 for a diagram-heavy page.
Pikchr: geometric and mathematical figures
Pikchr is the only tool here that can produce a true geometric diagram: axes, plotted points, lines at angles, annotated distances. For ML content specifically, the kinds of figures that appear in textbooks, hyperplane geometry, information-geometric visualizations, filter response diagrams, Pikchr is the only viable option among these four.
The cost is full manual placement. And the build-from-source install means you need to commit the binary path to your build script and document the build process for anyone else who runs it.
Mermaid: sequence diagrams and general flowcharts
Mermaid is the most versatile general-purpose tool here. For sequence diagrams with loops and conditional branches it has no competition. For straightforward flowcharts and architecture diagrams where the layout does not need to be tuned, it is fast to write and produces clean output.
The npm installation is the lowest friction of any of the four, and the Puppeteer-based CLI works out of the box without additional system configuration.
The Mermaid vs D2 Question
I am still not decided between these two for the general case. Both handle flowcharts and architecture diagrams. The cases where they diverge:
Mermaid is the better choice when:
- The diagram is a sequence diagram with
looporaltblocks - The layout needs to be compact and horizontally layered
- The diagram needs to be readable outside the blog (GitHub README, shared link)
- Minimal setup friction matters
D2 is the better choice when:
- The diagram has deeply nested containers with internal edges
- The graph is dense enough that ELK’s routing is worth the larger SVG
- You want clean markdown-formatted multi-line labels without HTML in the source
- You are willing to live with the embedded font overhead
In practice I have ended up using them for different diagram types rather than picking one. Mermaid for sequence diagrams, D2 for infrastructure and architecture layouts, Pikchr for anything geometric, Graphviz for DAGs and dependency structures.
Installation Summary
# Graphviz
brew install graphviz        # macOS
apt install graphviz         # Ubuntu

# D2
brew install d2
# or: curl -fsSL https://d2lang.com/install.sh | sh

# Pikchr (build from source)
git clone https://sqlite.org/pikchr pikchr
cd pikchr && make
# binary at ./pikchr — note the path in your build script

# Mermaid CLI
npm install --save-dev @mermaid-js/mermaid-cli
Quick version check:
dot -V          # graphviz 12.x
d2 --version    # v0.7.x
mmdc --version  # @mermaid-js/mermaid-cli 11.x
Pikchr has no version flag. Run ./pikchr --help to confirm the binary works.